Travellers want real-time information updates
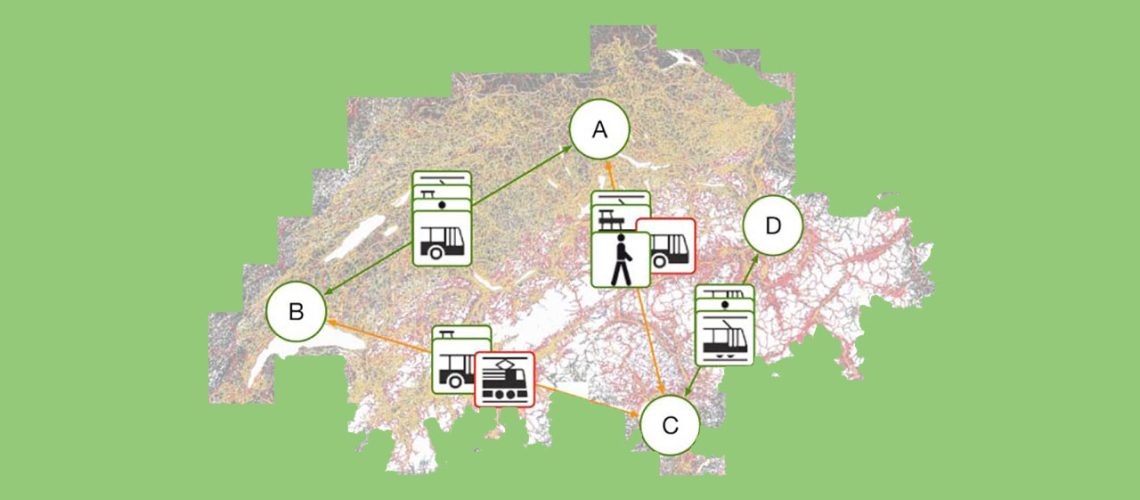
Every day, millions of travellers and commuters change from one transportation mode to another. Train to bus to walking, any change of mode happens following the indications of transportation service providers. To achieve efficient travel planning, the information from all the relevant providers must be integrated, to be quickly and readily accessible on the spot. Additionally, when there are service interruptions or delays, the users need to be informed in real-time.
From a software development standpoint, searching for the best route on 1 or 2 transportation modes is straightforward. However, when the transportation modes are many, the number of possibilities to be explored becomes very large, and the problem enters the domain of search engines.
Single-mode routing is a database integration problem.
Multimodal routing is a search engine problem.
Multimodal routing
An effective travel routing and planning system must be able to find the best possible route by combining segments of different transportation modes. This constitutes a challenge because timetable and other information are stored in different databases, often heterogeneous. Applying parallel querying doesn’t provide the required functionality, while serial querying of individual multi-modal segments leads to exceedingly long response times. Additionally, a serial architecture has no deterministic means of finding the best route according to specified criteria (e.g., travel time, walking distance), leading to low-quality results.
An effective solution for providing fast responsiveness is to integrate the information from the separate sources into a unique and uniform database, serving as routing index. An Integration Engine makes sure that the unified database is always updated, and is able to add new data sources as they become available.
Multi-Criteria Travel Planning
An effective routing and planning system must be able to automatically choose the best combinations of travel segments following specified criteria (e.g., travel time, number of stops). To enable this, the information relevant to the criteria must be stored for each segment. In a relational database model, this information would be stored in a table specific to each travel node type. While searching for the best combination, this table would need to be queried at each iteration, leading to excessively long computation times for large datasets.
To maintain performance and scalability, the information about the search criteria must be readily available at each node. The graph database model features this fundamental characteristic, directly and physically containing a list of relationships to other nodes. Edge Weighted Directed Graphs are particularly well-suited for multi-modal transportation networks, easily enabling multi-criteria searches without significant loss of performance
Graph databases need one query for all modes of a segment, taking less time than relational databases
Segment-wise Control
Segment interruptions are a daily occurrence in the transportation business. Much effort goes in the prevention, detection, information, and resolution of exceptions. When searching the best route from A to B, interruptions must be integrated as soon as possible to avoid providing travel information that does not correspond to reality. Additionally, interruptions must not reduce the performance of the routing system.
In a graph database model, exceptions can be easily integrated as a lightweight overlay database on top of the network nominal state. This configuration allows for fast modifications of individual segments —even for just subsets of users— without perturbation of the nominal performance.
An ideal architecture therefore uses a combination of graph and relational databases. Relational databases contain the comprehensive, rich information, while graph databases contain the essential information to efficiently perform multi-modal routing.
Performance considerations in the Swiss context
The Swiss-wide Door-to-Door transportation network comprises more than 700’000 geospatial points.The Swiss transportation network comprises rail, light rail, cable cars, shared cars, ships, and more. When choosing the best route from station to station, all possible stations must be considered. Their number is impressive: On the Swiss rail network, there are more than 1’300 stations, and many more are present at the regional level (more than 2’700 in the Zurich region alone). While this order of magnitude appears manageable in the context of an IT-based solution for travel planning, the number of data points grows by a factor of 100-10’000 when considering walking and cycling on roads. In Switzerland, there are more than 70’000 km of roads, and subsampling, as an example, with an average density of 10 m results in 7’000’000 geospatial points. The computational implications of such a high number of points to be considered are considerable, and require careful attention for the choice of technology
While relational databases are the powerhouse of information technology since the 80s, and the best choice for many applications, they present some fundamental limits when it comes to calculate multi-modal relationships following different search criteria. These limits concern mainly the poor scalability of the required explicit joins between waypoint tables, and the lack of efficient dynamic queries and efficient routing algorithms in SQL. In a relational database, connections between discrete data is more challenging to store and slow to query.
These limits indicate the need for a mixed solution: an efficient index optimised for routing, and relational databases to store the large amount of data. While it could be argued that relational databases are not strictly necessary, their near ubiquity make them the natural choice to avoid further short-term costs. For what concerns the index, graph database models provide an effective solution for routing applications
The Swiss-wide Door-to-Door transportation network comprises more than 700’000 geospatial points. To scale routing to many transportation modes, a graph database model is the best choice.
Graph Database Models
A graph database is an online (“real-time”) database management system with CRUD (Create, Read, Update, and Delete) methods that expose a graph data model. A graph is a representation of a set of objects where some pairs of objects are connected by links (e.g., a train network of stations connected by rail segments). Graph databases are generally built for use with transactional (OLTP) systems. Accordingly, they are normally optimised for transactional performance, and engineered with transactional integrity and operational availability in mind.
- Reliable with real ACID (Atomic, Consistent, Isolated, Durable) Transactions
- Scalable through High-Availability clustering
- Embeddable on the JVM or server with HTTP API
Several leading organizations rely on Graph Databases. For instance: Lufthansa Systems, Lockheed Martin, Adobe, Hewlett-Packard, SFR, Cisco, Deutsche Telekom, Telenor, Accenture, Google. The reason why these organizations chose Graph Databases are the following.
“Minutes to milliseconds” performance
The graph data model reduces the impedance mismatch, thereby reducing the development overhead of translating back and forth between an object model and a tabular relational model. More importantly, the graph model reduces the impedance mismatch between the technical and business domains: subject matter experts, architects, and developers can talk about and picture the core domain using a shared model that is then incorporated into the application itself.
Extreme business responsiveness
Successful applications rarely stay still; changes in business conditions, user behaviors, and technical and operational infrastructures drive new requirements. In the past, this has required organizations to undertake careful and lengthy data migrations that involve modifying schemas, transforming data, and maintaining redundant data to serve old and new features. The schema-free nature of a graph database coupled with the ability to simultaneously relate data elements in lots of different ways allows a graph database solution to evolve as the business evolves, reducing risk and time-to-market.
Drastically accelerated development cycles
Data is important: when employed in a business-critical application, a data technology must be robust, scalable, and more often than not, transactional. Graph databases are newer than relational databases, but they provide ACID (Atomic, Consistent, Isolated, Durable) transactionality, high-availability, horizontal read scalability, and storage of billions of entities. The performance and flexibility to handle a vast number of entities has become a standard requirement for large enterprises today. This has been an important factor leading to the adoption of graph databases by organizations: not merely in modest offline or departmental capacities, but in ways that can truly change the business.
Enterprise ready
Query performance and responsiveness are at the top of many organizations’ concerns with regard to their data platforms. Online transactional systems, large web applications in particular, must respond to end users in milliseconds if they are to be successful. In the relational world, as an application’s dataset size grows, join pains begin to manifest themselves, and performance deteriorates. Using index-free adjacency, a graph database turns complex joins into fast graph traversals, thereby maintaining millisecond performance irrespective of the overall size of the dataset.
Data Representation for Multimodal Routing
Geospatial is the original graph use case: Euler solved problem of the Seven Bridges of Königsberg by positing a mathematical theorem that later came to form the basis of graph theory. Geospatial applications of graph databases range from calculating routes between locations in an abstract network such as a road, rail network or logistical network to spatial operations such as find all points of interest affected by an accident outage and calculate under-utilised or under-served areas. Geospatial applications of graph databases are today particularly relevant in the areas of travel, logistics, travel, timetabling, and route planning
In the case of door-to-door routing, the network comprises interconnected stations and topographic coordinates accessible to pedestrians. In the Property Graph representation, each of these nodes has properties (key-value pairs) such as name, location, type (“rail”), and so on. Also the relationships have properties, such as type, direction, closest hub, timetable, fare, and so on. Properties can be chosen and updated to best serve the travel-planning algorithms.
Timetable information is embedded in the graph. Although the Swiss transportation network is dense, the number of relationships and nodes does not make for any so-called super-node (>10’000 relationships per node). Zurich is one of the most dense stations in the world, and on average, every day more than 2’900 trains transit through Zurich. Graph databases can easily handle super-nodes below 100’000 relationships each.
In a multi-modal network, stations and relationships serve different transportation means. Stations have multiple direct and indirect interconnections. This allows for many possible solutions to be chosen for going from A to B.
Because different transportation modes have different characteristics (e.g., speed, range), they naturally order stations according to a service hierarchy. For instance, larger train stations are Swiss-wide hubs (1st order), while local bus stops are local hubs (3rd order). Following this organization in structuring the graph data and informing the algorithms about priorities allows keeping the depth of search low, and thus the query time short. The information is stored in the graph as labels.
Test-Driven Data Modelling
In the development practice of test-driven data modelling, unit tests are written based on small, representative example graphs drawn from the transportation domain. These example graphs contain just enough data to communicate a particular feature of the domain; in many cases, they might only comprise 10 or so nodes, plus the relationships that connect them. These examples describe what is normal for the domain, and also what is exceptional. As anomalies and corner cases are discovered in our real data, specific tests are written to tackle them. This unit-testing approach to graph data model development enables us to respond to new business needs with very little risk of undermining or breaking what has come before, confident in the continued quality of the solution.
Integration Engine —
From multiple sources into a unique, homogeneous database
The source data of a transportation network reside in several databases. For a travel planner to work, the source data needs to be integrated into a unique and homogeneous database. An Integration Engine makes sure that the unified database is always updated, and is able to add new data sources as they become available. This system is made of a set of ad hoc Data Importers (1 per data source) that run in parallel and convert the source data into the common format, transformed downstream to best serve the application. In the case of door-to-door travel planning, this is a system of relational and graph databases that is designed to be updated in real-time.
For the data to reflect the real situation of the transportation network, the data system must be capable of frequent updates. Updates range from yearly timetable changes to day-long interruptions of a rail relationship to 15-minute bus delays due to traffic. Timely updates are a cornerstone for customer satisfaction. By applying a mixed update model, it is possible to ensure data integrity while keeping users informed in real time:
- A Baseline graph with reads separate from writes, updated once every 24h, at night;
- An Overlay Real-Time Adjustment graph for handling exceptions (e.g., line interruptions, delays);
- A Unified relational database for look-up.
The Data Importers each import data from a specific source, at planned intervals (e.g., yearly timetable change). The data is cleaned and derived data is generated to unify the information. The Unified Data is a staging database, from which to create the Baseline and Real-Time Adjustment graphs, as well as a production version of the Unified Data for rich content look-up.
The role of the Baseline Updater is to create, correct, and optimise the Baseline graph.
The Adjustment Updater has a similar role, although it operates on the Real-Time Adjustment graph, which has the same the node-relationship structure as the Baseline, but is lightweight as it contains only information about transportation network exceptions. When the Baseline graph is queried, the Adjustment graph flags the relationships that are interrupted, delayed or other. The Adjustment Updater is fed by the Real-time Handler, which receives exception information from the data sources. The operation of this component is very fast, allowing to modify the Adjustment graph, and thus the results of the user, in real-time.
New versions of the graphs are pushed only once daily, at a time during the night when the transportation network is less active, and queries are seldom. This way of separating the reads from the writes, and batching the writes allows maintaining query performance. Graph Databases are very fast in reading, while they are slower in writing (especially transaction commits). Writes to a graph database are to be written to a single master, while as read can be performed by number of slaves. When a transaction commits, the data accumulated in session so far is written to disk synchronously, so that it is visible for other transactions.
Computing Engine —
Informed routing algorithms
The Computing Engine operates in 2 stages:
- Query the Baseline and Adjustment graphs to find the optimal route following the specified criteria;
- Based on the response, query the Unified database to populate the consolidated response.
Several routing algorithms are available for Graph Database Models. Breadth-first algorithms are particularly good for path finding. For instance, the classic Dijkstra algorithm or the A* (“A-star”). The latter is based on the observation that some searches are informed, and that by being informed better choices can be made over which paths to take through the graph. For instance, travelling in Switzerland from Genève to Lugano, an informed search wouldn’t go through Basel first. A* is both like Dijkstra in that it can potentially search a large swathe of a graph, but it’s also like a greedy best-first search insofar as it uses a heuristic to guide it. A* combines aspects of Dijkstra’s algorithm, which prefers nodes close to the current starting point, and best-first search, which prefers nodes closer to the destination, to provide a provably optimal solution for finding shortest paths in a graph.
In A*, the path cost is split into two parts: g(n), which is the cost of the path from the starting point to some node n; and h(n), which represents the estimated cost of the path from the node n to the destination node, as computed by a heuristic (an intelligent guess). The A* algorithm balances g(n) and h(n) as it iterates the graph, thereby ensuring that at each iteration it chooses the node with the lowest overall cost f(n) = g(n) + h(n).[
An effective real-time system, using existing data
While single-mode routing is a database integration problem, multimodal routing is a search engine problem. The underlying reason is that the number of possibilities to be explored is very large, and is optimally solved using existing algorithms and data structures developed for text-base information search.
Ex Machina provides effective door to door travel planning using a combination of search and database technologies. First, our Integration Engine collects and prepares all source data into a homogeneous form, and extracts the routing information into a graph database. Then, our Compute Engine applies search algorithms to the graph database, retrieving in milliseconds the optimal route following the specified criteria. Last, the additional information about the best routes is retrieved and presented to the user.


